Runners Data
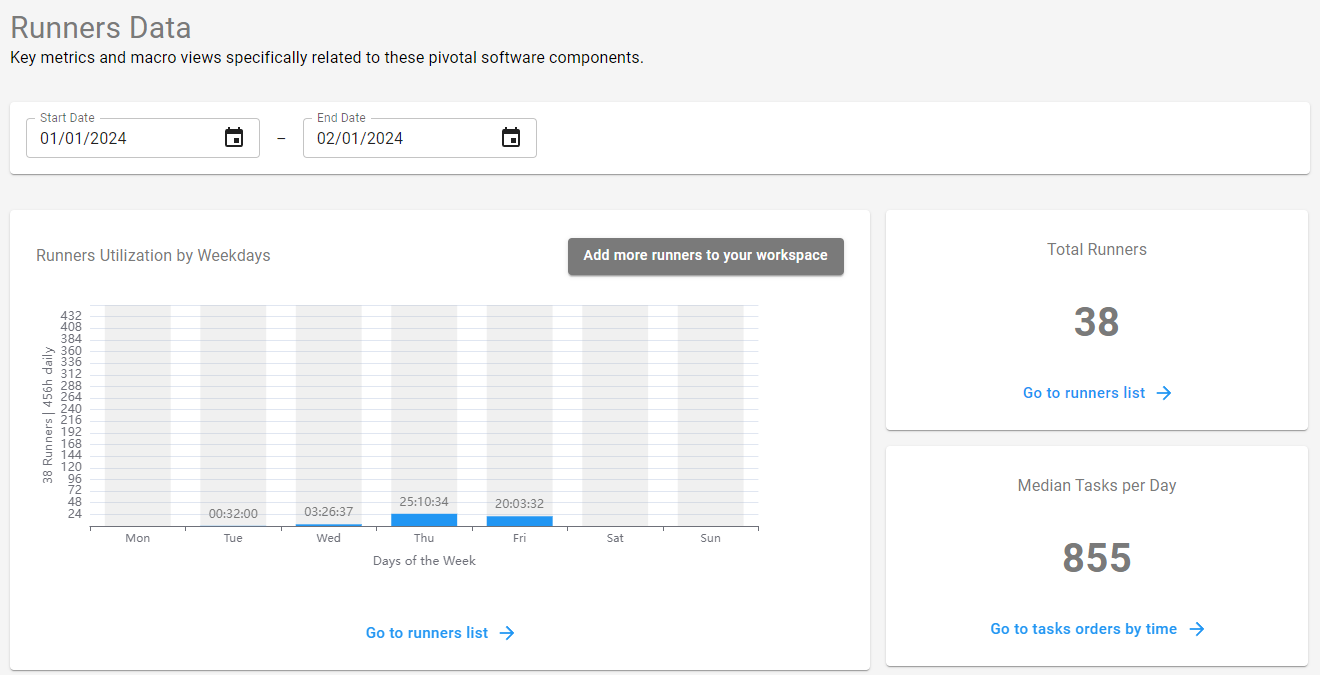
In this section, we can visualize key metrics and macro views specifically related to Runners.
We can obtain indicators about the utilization rate of each Runner and also visualize an average of tasks executed per day.
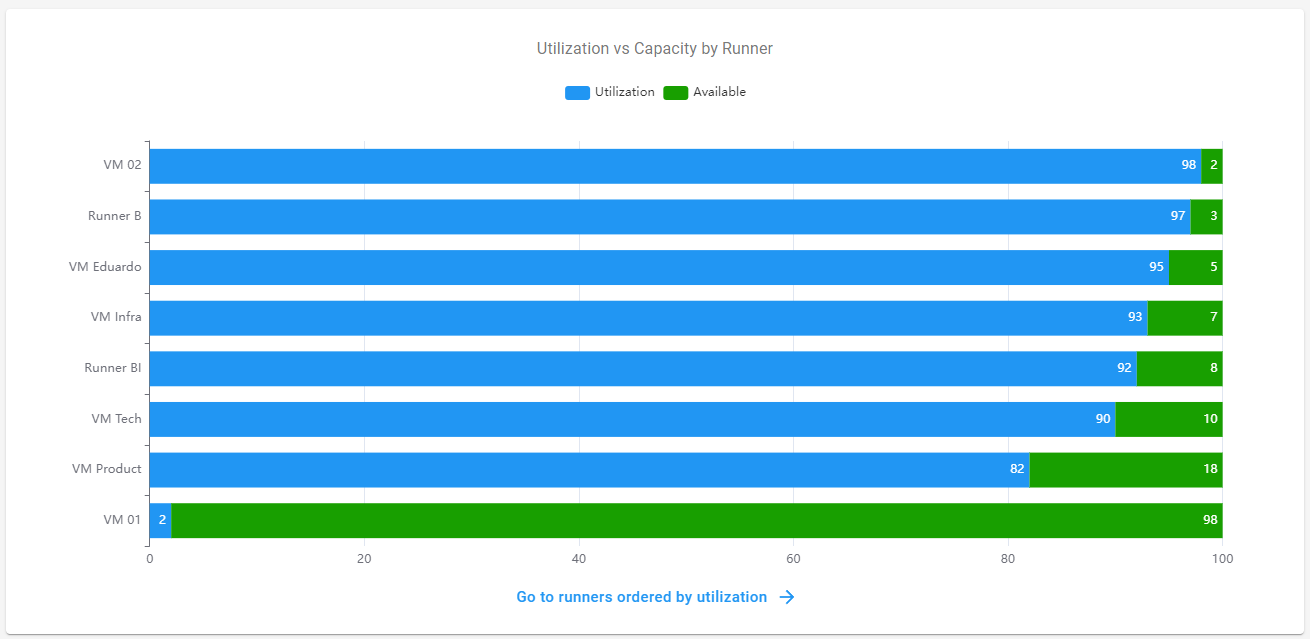
Utilization vs Capacity per Runner
The dashboard containing data regarding the utilization and capacity of Runners will display a percentage indicating the occupancy rate of each Runner based on the selected time filter.
Thus, the idea is to visualize a percentage of the number of hours a Runner was used for task processing, relative to its capacity for the given time period.
For example, considering the total 24 hours of the last 30 days that the Runner could have been available (24h X 30 days), we can visualize the percentage of this time that was used for task processing, i.e., how much this Runner was utilized considering the total time it could have been available during this period.
Warning
This Utilization vs Capacity indicator is based on the time spent on task processing, not on the time a Runner was "Online" or "Offline".
Therefore, this indicator follows the idea of measuring what was used considering the total availability, rather than measuring the utilization rate in "real-time".
Tasks and Items per Runner
In addition, we can also visualize more specific dashboards, such as the number of tasks per Runner, items processed per Runner, and items processed with failure for each Runner.
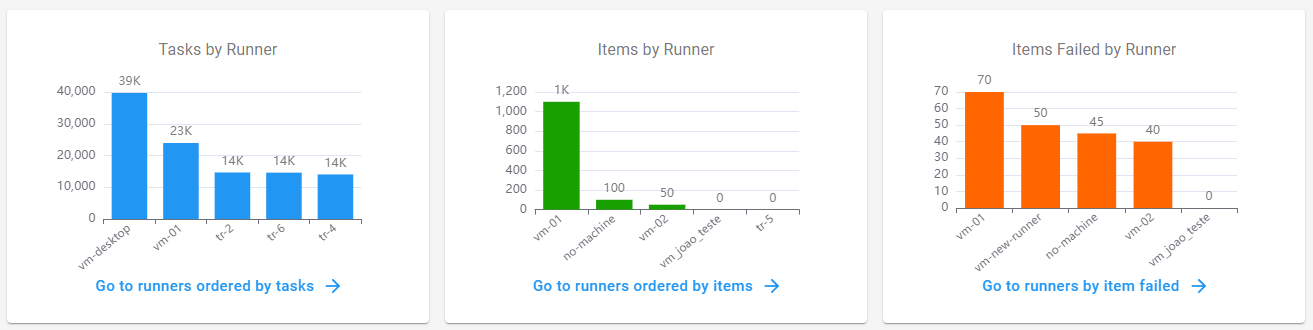
Important
The information displayed in the Runner dashboards is based on the tasks that were processed by each Runner.