Dashboard
In the BotCity Insights Dashboard, workspace administrators can have a concise view of critical platform data and essential indicators related to processes.
Important
In order to efficiently build dashboards with relevant data, workspace administrators need to configure and input all necessary information beforehand.
Tip
-
In the Data Input section, you can configure and input the information that will be used as the basis for building the dashboards.
-
In the Reporting Data section, you can find more details on how to report data through your automation code.
Financial
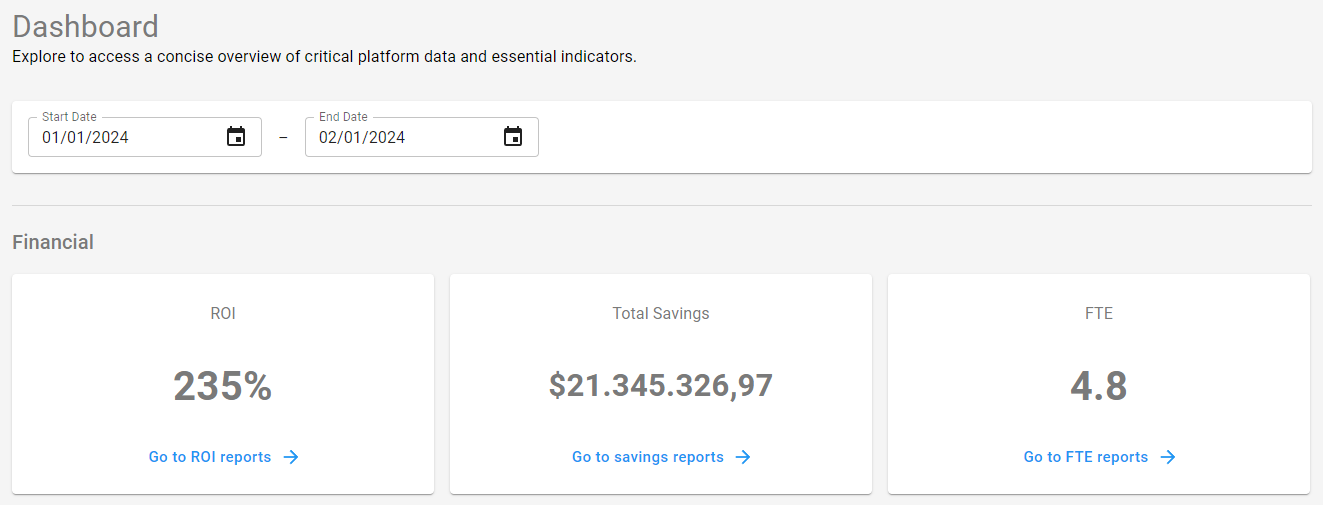
BotCity Insights allows us to record and visualize high-level information about financial results and impacts.
Among the automatically calculated and displayed financial information are:
ROI
This indicator measures the efficiency and profitability of an RPA investment. It displays a rate of the financial benefit obtained in relation to the initial implementation and maintenance cost of the RPA solution.
How is ROI calculated?
The ROI calculation is based on the following formula:
Total Savings
In RPA, it refers to the quantifiable financial benefit obtained from the implementation of RPA technology. This includes all direct and indirect cost reductions resulting from automation.
How is Total Savings calculated?
The Total Savings calculation is based on the following formula:
Note: The Total Savings calculation does not take into account the investment value, but rather the human cost per each processed item.
FTE
Abbreviation for "Full-Time Equivalent". This indicator measures productivity by comparing the number of items a robot can process to the number of items a human can process in the same period of time.
How is FTE calculated?
The FTE calculation is based on the following formula:
RPA Initiative
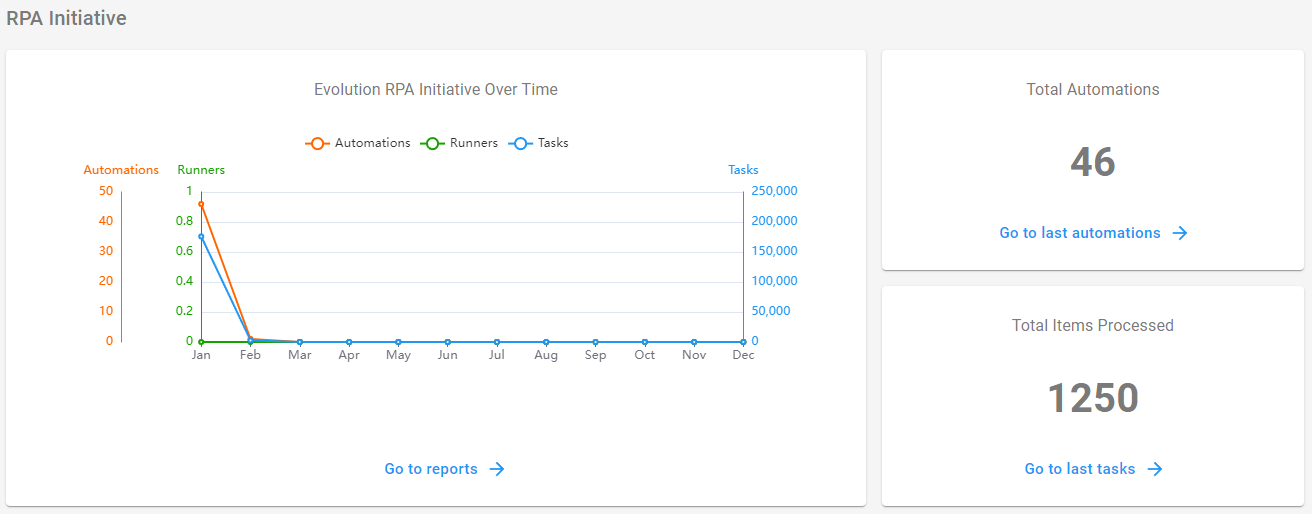
In this section, we can view dashboards containing information about the evolution of the RPA initiative over time.
From this section, it is possible to access reports on the latest automations and tasks containing processed items.
How are these indicators calculated?
- Evolution over time: This graph shows the number of Automations created (orange), Runners (green), and Tasks run (blue) on a month-to-month basis over the past year. Workspace administrators will be able to clearly track the numbers increasing as the initiative grows.
- Total automations: This is simply the sum of all automations that the workspace has, and by clicking it, you can see each of them listed in the reports section.
- Total items processed: Here we show the count of each successfully processed item in this workspace, and by accessing the link, you can also view the latest tasks and the quantity of items processed in each of them.
Automation Efficiency
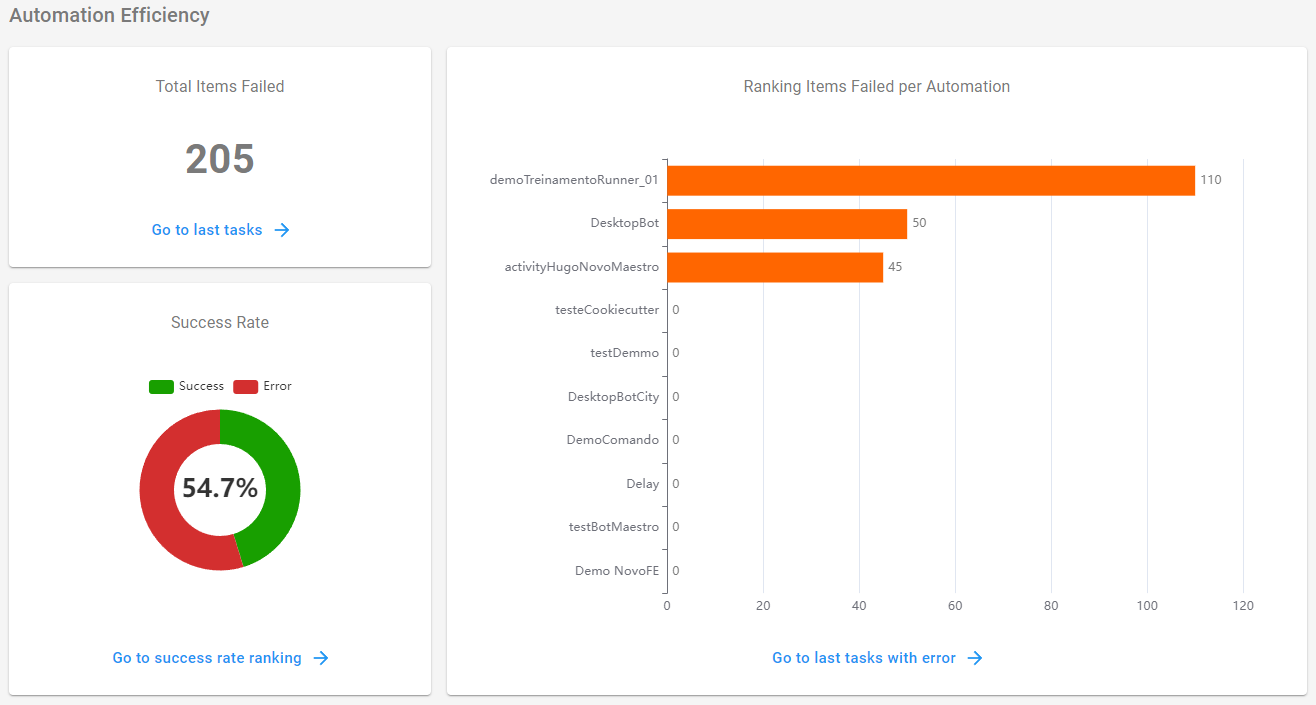
In this section, we can visualize the efficiency of automation processes.
In addition to an indicator containing the total number of errors and the success/accuracy rate, we also have access to a graph showing the number of errors per automation.
How are these indicators calculated?
- Total items failed: Here we show the count of each item that failed to process in this workspace, considered as an error. By accessing the link, you can view the latest tasks and the quantity of items that failed in each of them.
- Success rate: Success here refers to the successful processing of all items, and error represents the items that failed. Therefore, the rate is the proportion of successfully processed items versus those that failed. By accessing the link, you can see the full list of automations and their respective success rates.
- Ranking of failed items per automation: Here we bring the automation processes with the most failed items, ranking them by the quantity of failed items each one has.
Capacity and Velocity
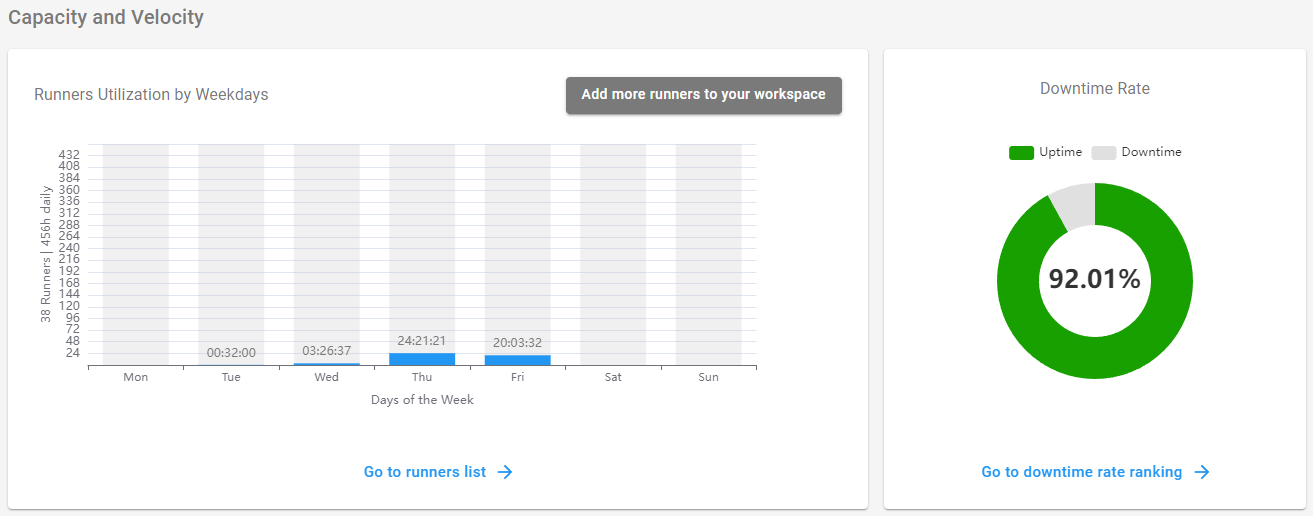
In this section, we can view information about the workspace's Runners and also have a general view of the automation downtime rate.
Runner Utilization
Here we show the task distribution trend by day of the week, considering the behavior over the last 30 days.
By accessing the link, you can view the list of Runners in the reports section.
Info
You can view more detailed information about the Runners by accessing the Runners Data page.
Downtime Rate
The downtime rate of an automation can be understood as the percentage of time spent processing failed items.
Thus, the rate refers to the proportion of the sum of time spent on failed items, considering the total execution time of the tasks.
For example, considering a scenario where the task processed 100 items successfully and 1 item failed during a 4-hour period, the downtime rate corresponds to the calculation of the time spent processing that failed item.
By accessing the link, you can view the ranking of automations considering the downtime rate of each one in the reports section.


